
Native PowerPoint
Every object is a real object.
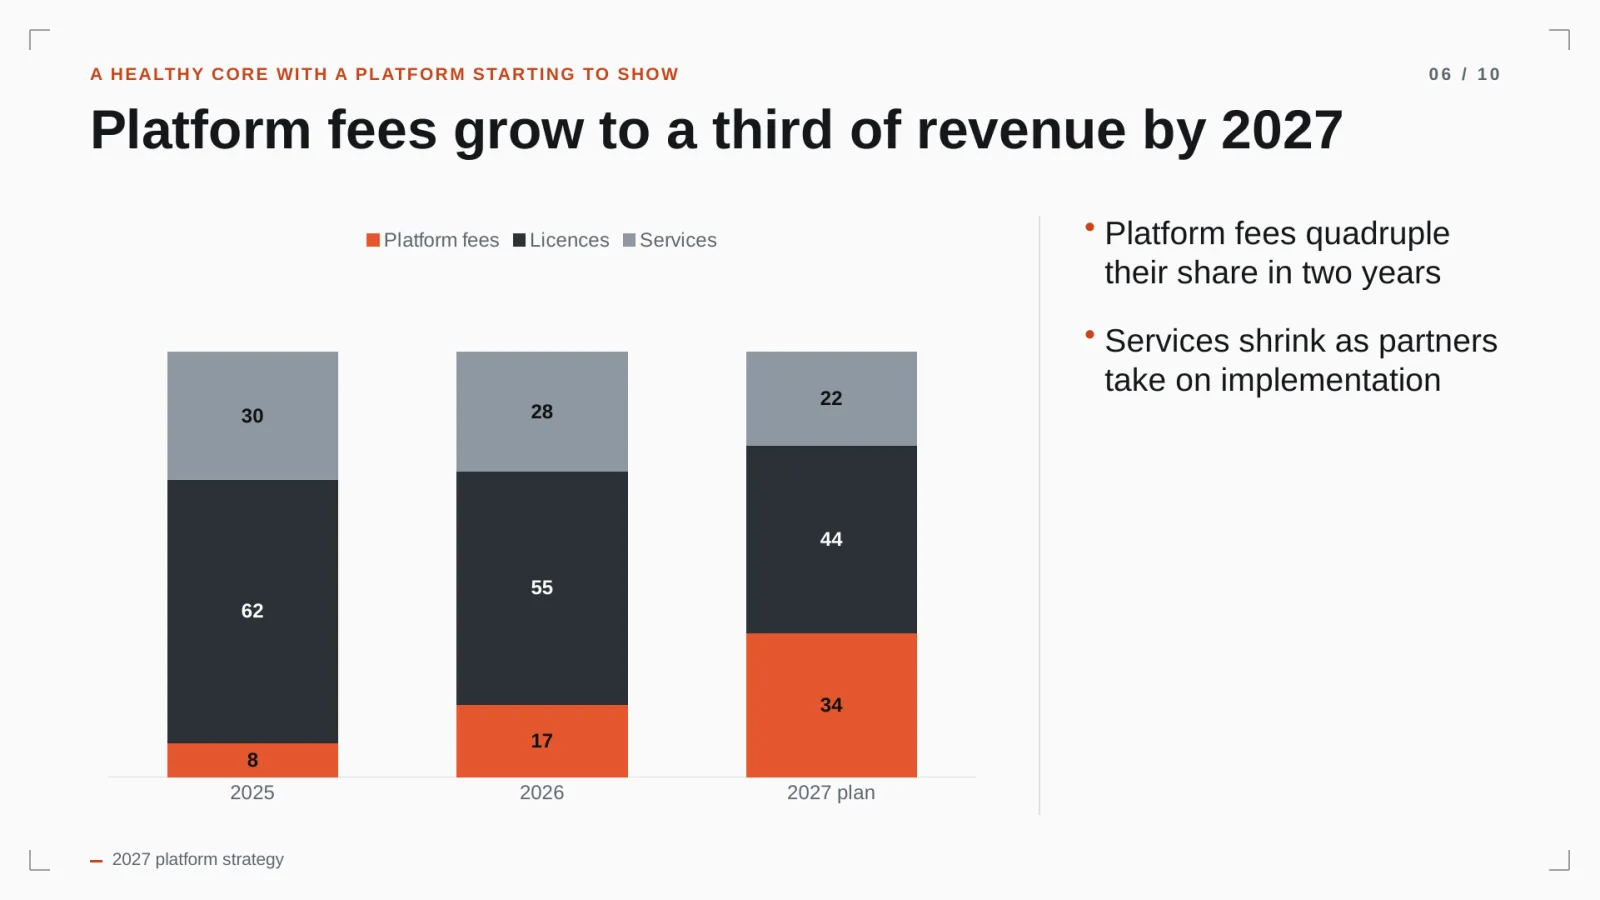
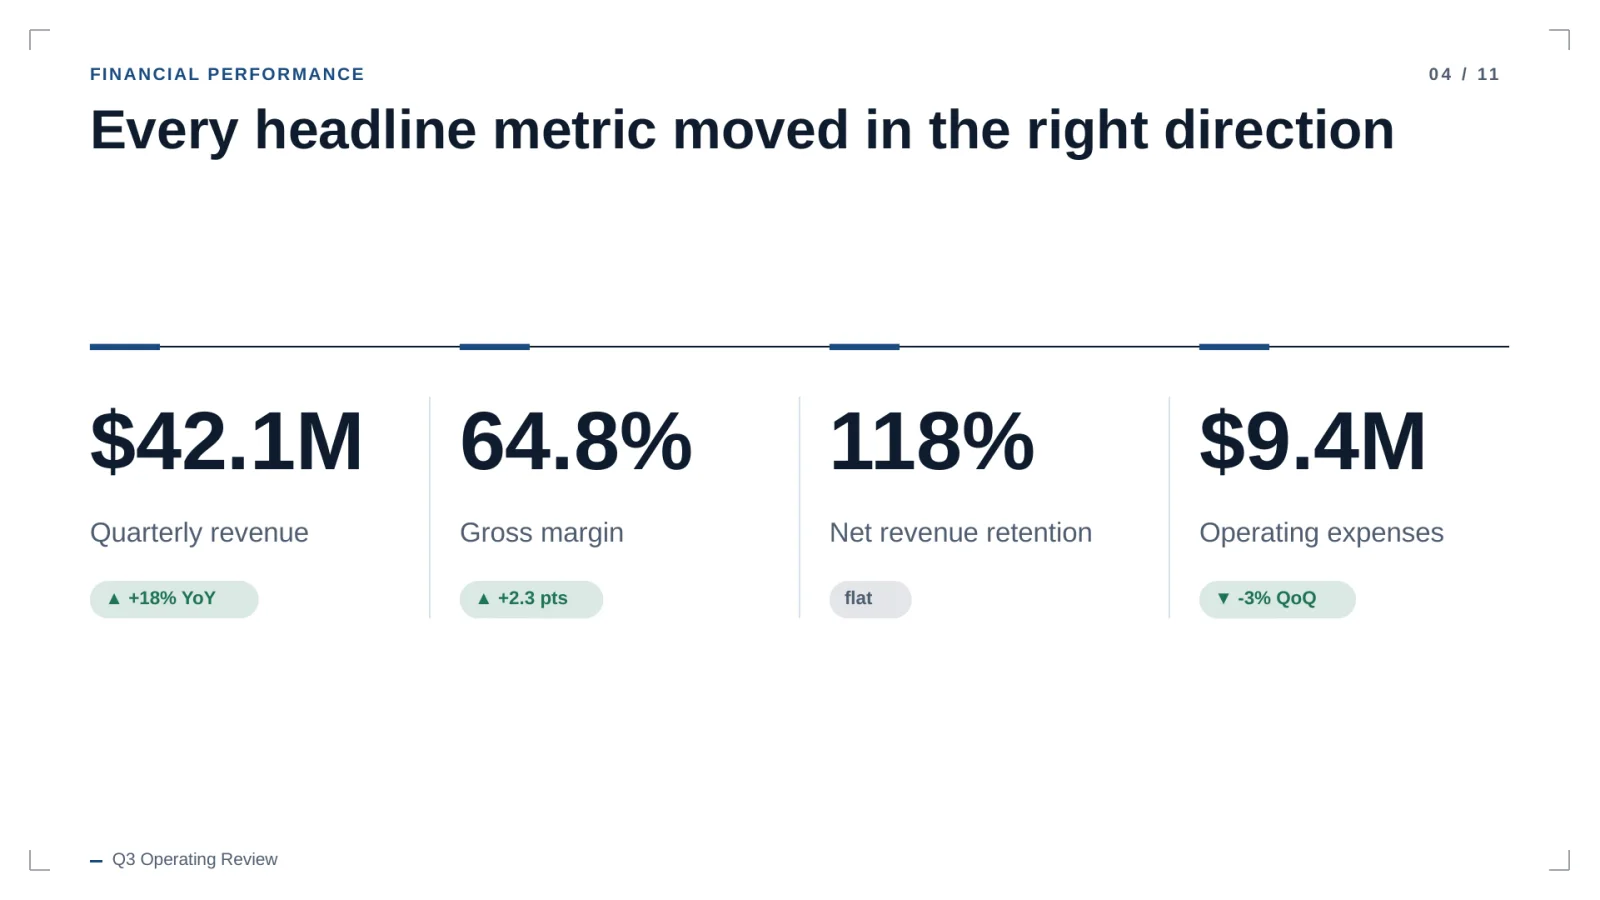
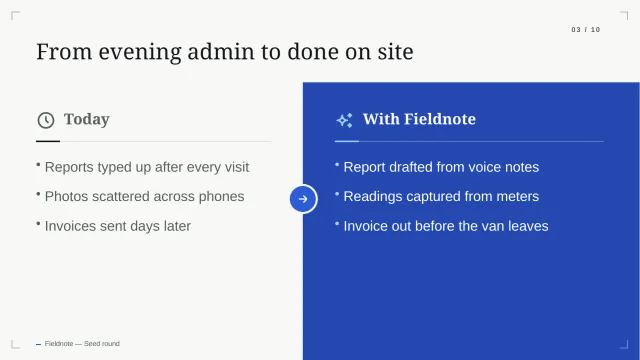
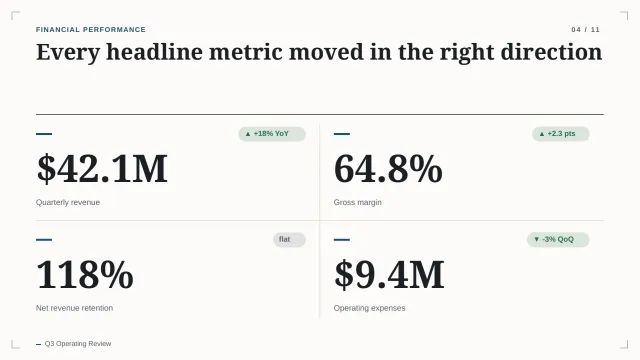
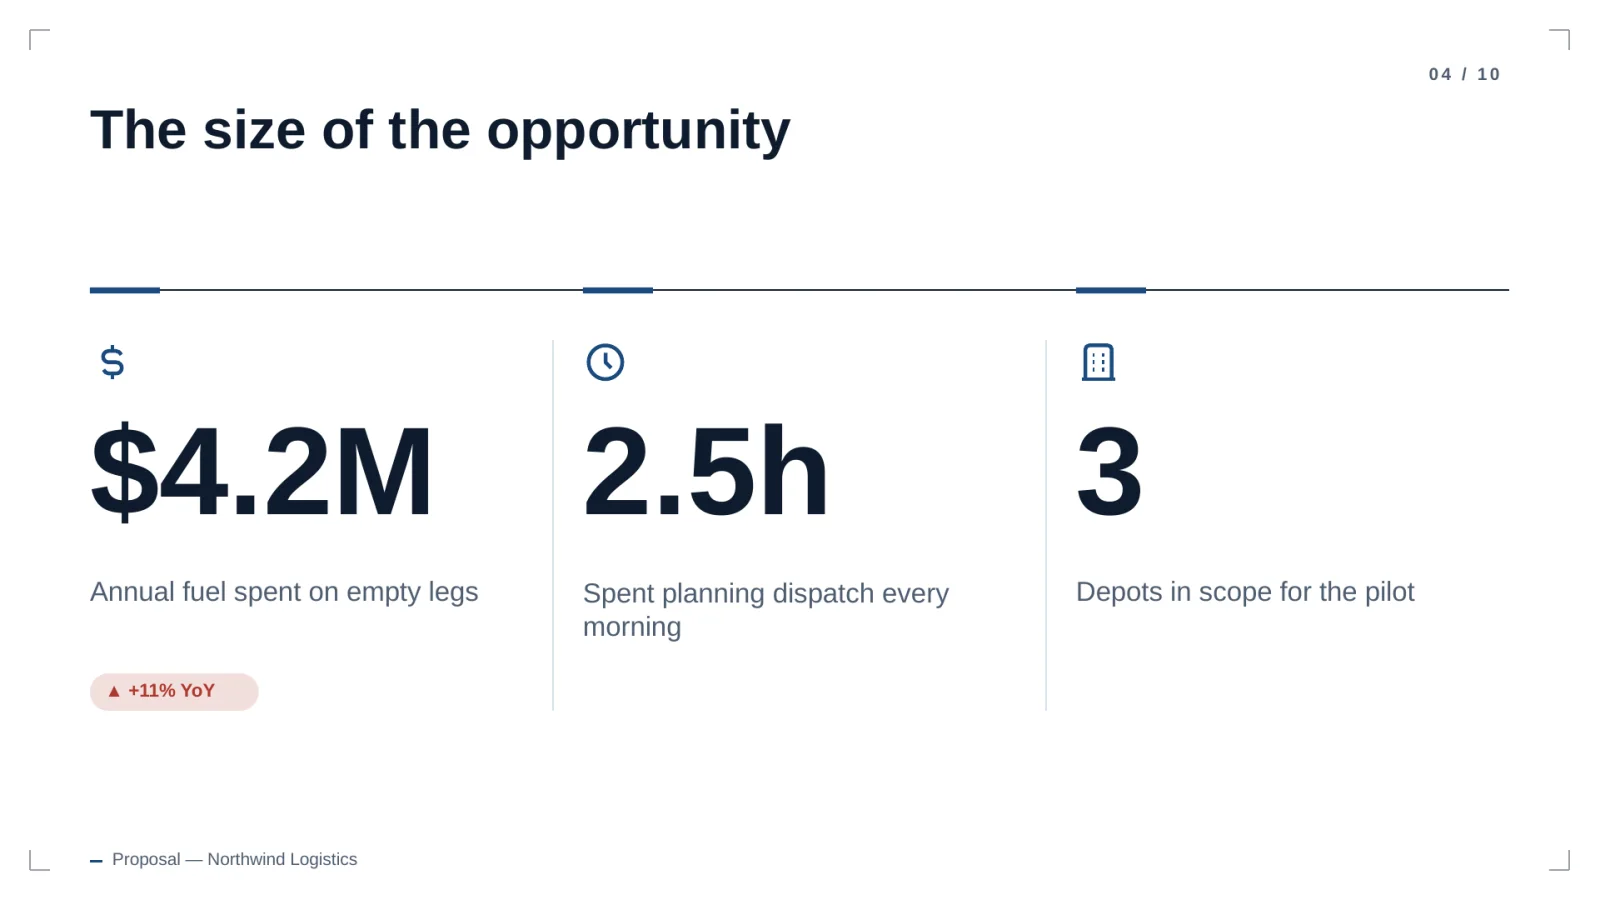
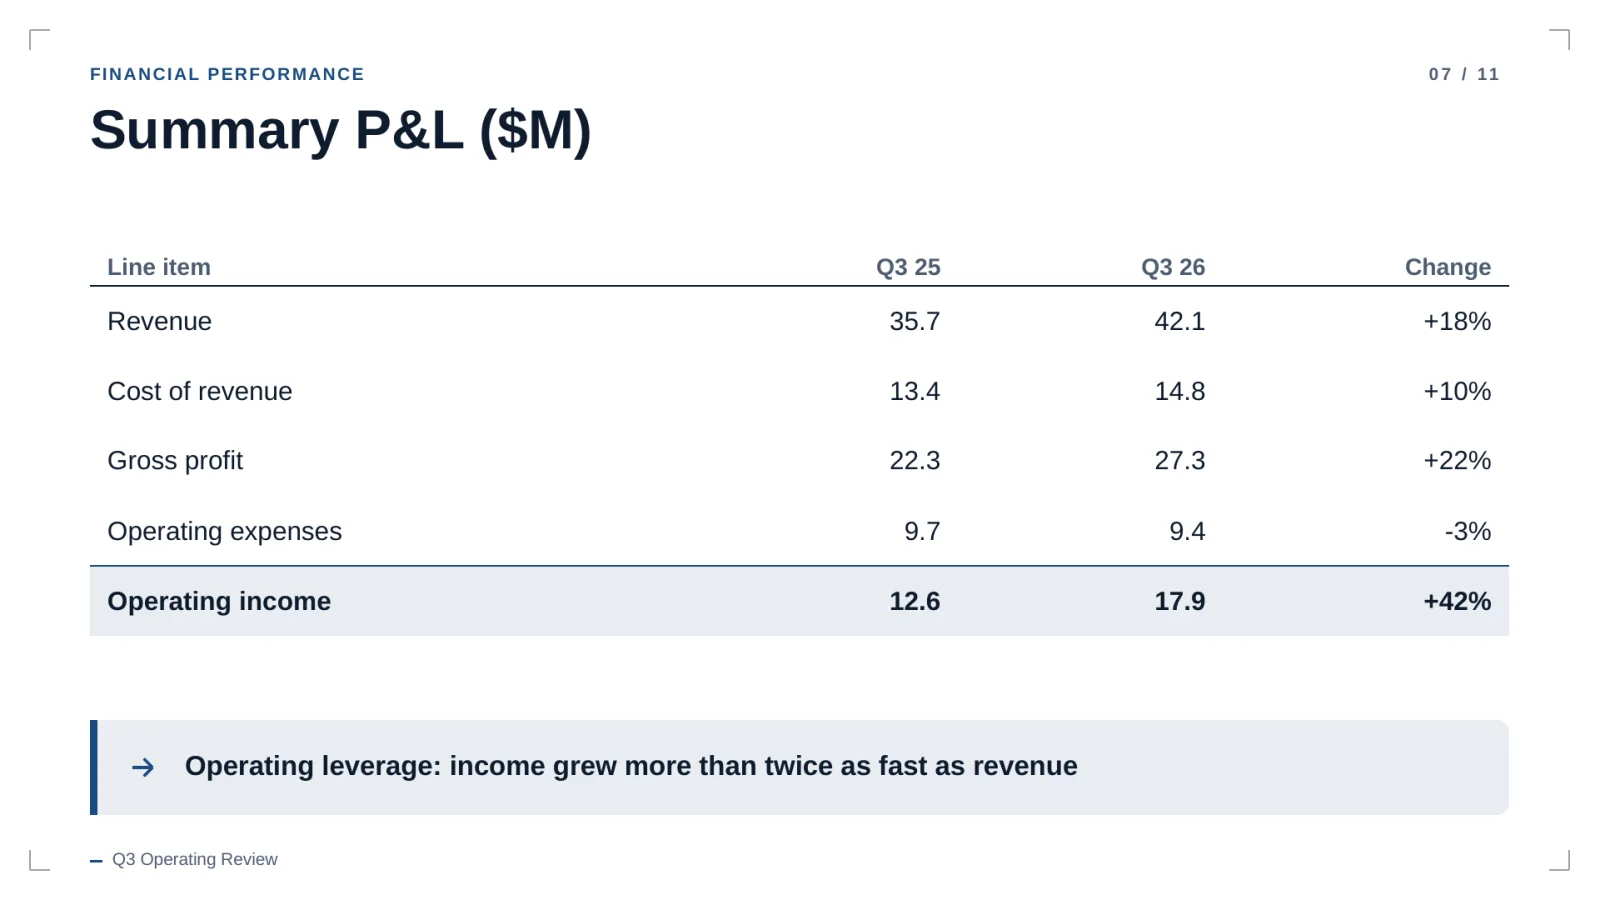
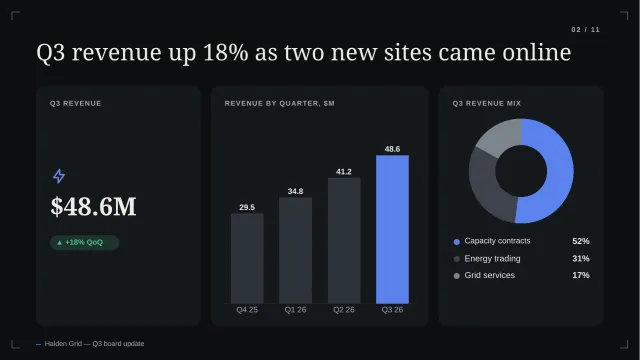
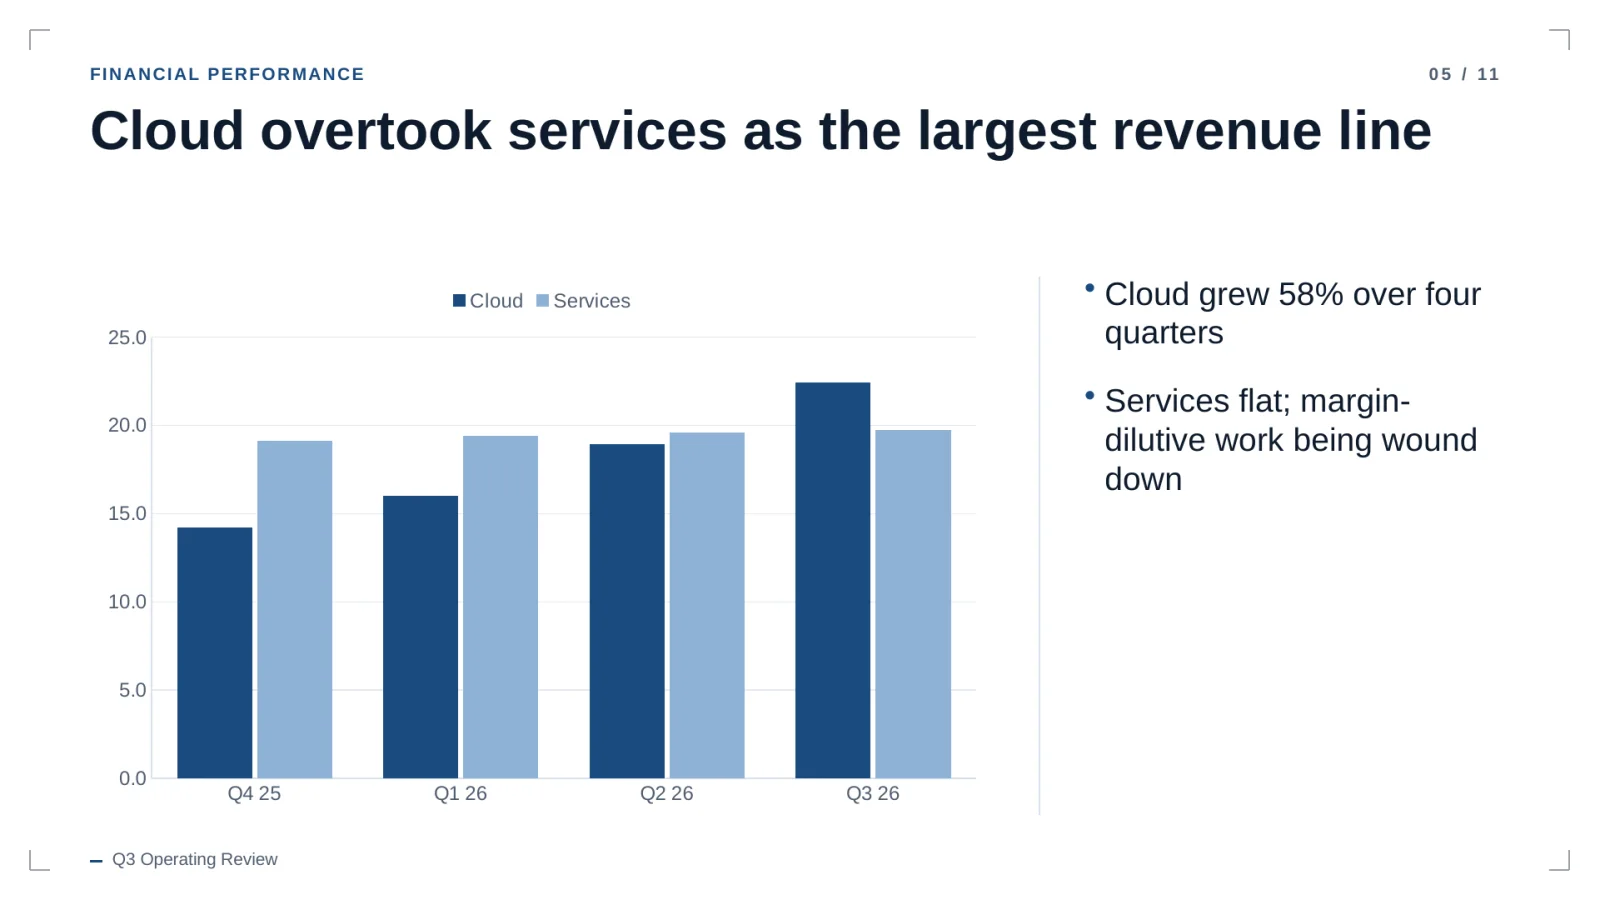
Charts open with their data in PowerPoint's own editor. Tables are cells you can add rows to. Text sits in normal text boxes and wraps when you rewrite it. Nothing is flattened into a picture.
- Column, bar, line, pie and doughnut charts with embedded workbooks
- Tables with real rows, columns and header styling
- Fonts that exist on every machine, so the file looks the same everywhere